![]()
After more than 7 years, the new major version Prometheus 3.0 is here! Besides removing deprecated features, it brings native Open Telemetry support, a new UI, and more…
What’s New
Everything new in Prometheus 3.0.
New UI

The new UI is inspired by PromLens, cleaner and more polished.
You can temporarily switch to the old UI using the old-ui feature flag, if you really want to.
Since the new UI hasn’t been as thoroughly tested yet, there may be some bugs, and the authors are asking you to report any such issues on GitHub.
Remote Write 2.0
Remote-Write 2.0 is the next iteration of the Prometheus remote-write protocol, adding native support for new elements such as metadata, timestamps, and native histograms. At the same time, thanks to smart string interning, it reduces the amount of data transferred over the network and CPU load. There’s also improved support for partial writes and providing clients with more information when that happens. More details can be found in the remote-write 2.0 specification.
UTF-8
Prometheus now supports all valid UTF-8 characters in metric names and labels. UTF-8 in values has been supported since the 2.x versions.
If something is misconfigured on the client or server side, Prometheus automatically falls back to the original behavior: escaping using underscores (_). PromQL queries can now be written in quotes to support UTF-8 encoding. Alternatively, users can specify the name label manually.
Currently, UTF-8 is fully supported only in the Prometheus library for Go (Golang). But support for other languages has been promised as soon as possible.
Open Telemetry
Prometheus announced Open Telemetry support this spring and that they were working on it. The first part already landed in the 2.x series, but now with version 3.0, we have extended Open Telemetry support.
OTLP Ingestion
Prometheus now supports configuration to act as a native receiver of metrics in OTel format via the /api/v1/otlp/v1/metrics endpoint.
More in the documentation.
UTF-8 Normalization
With Prometheus 3.0 and UTF-8 support, it’s now possible to store and query OpenTelemetry metrics without having to modify queries to underscore notation (escaping).
Breaking Changes
The list of currently supported APIs in version 3.0 is here, and the migration guide to Prometheus 3.0 is here.
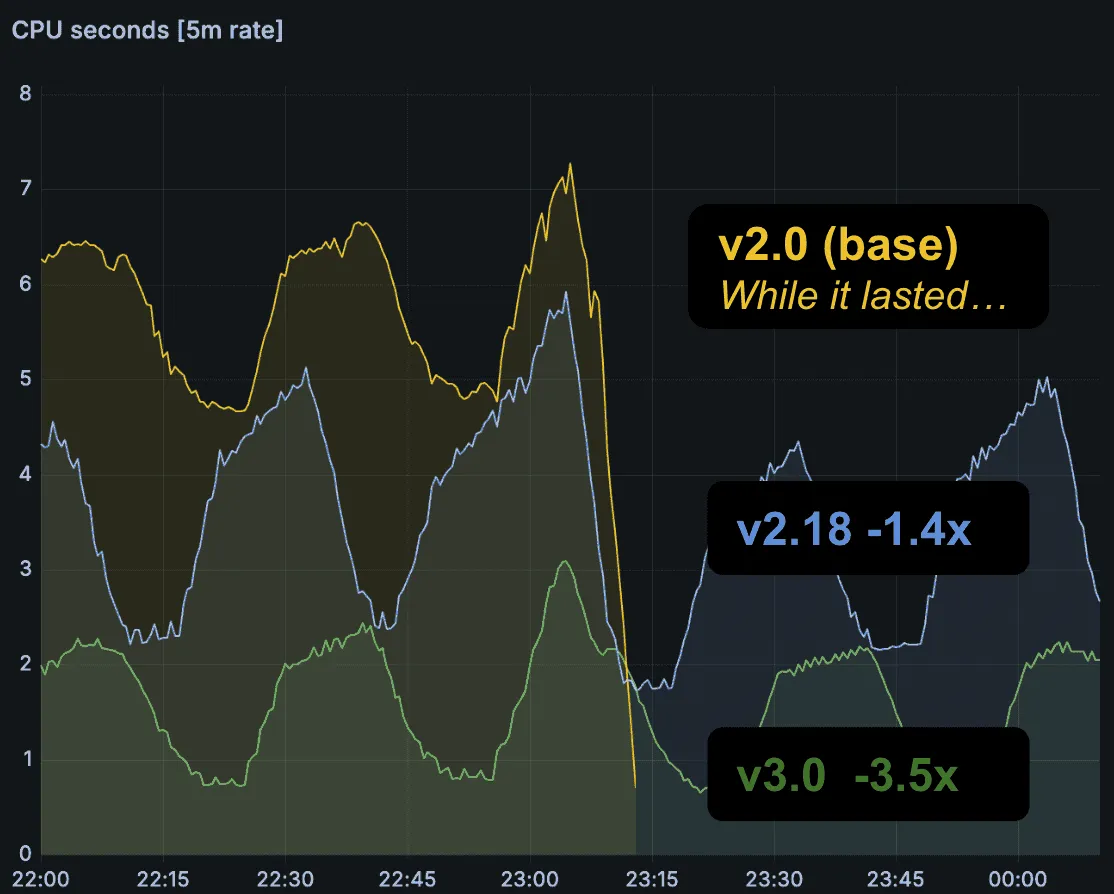
Performance and Optimization
The following images are from a Prometheus instance with 8 CPUs and 49 GB RAM.
- 2.0.0 (7 years ago)
- 2.18.0 (4 years ago)
- 3.0.0 (today)

Prometheus Operator
At the time of writing (November 11, 2024), Prometheus 3.0 is not yet supported by Prometheus Operator (for Kubernetes), but since the first RC release they have been diligently testing compatibility and working on support for the new version.
If you’re interested in everything else that changed, check out the Prometheus 3.0 release announcement on the Prometheus website.


